
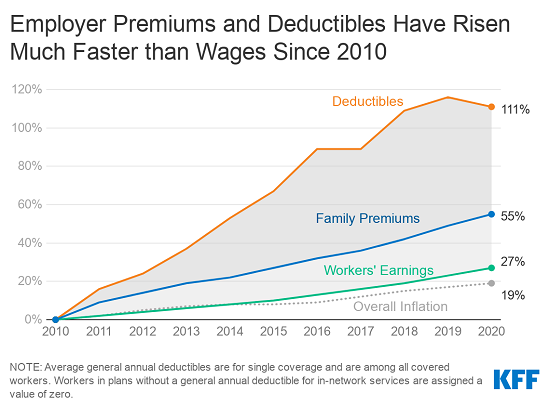
This graph represents the dynamics characteristic of traditional managed care plans (PPO). PPO contracts are tied to the billed charges, not costs. As billed charges go up each year, so do premiums, even though costs may have not gone up at all. Employers mitigate their increasing costs by reducing benefits. It’s a vicious never ending cycle.
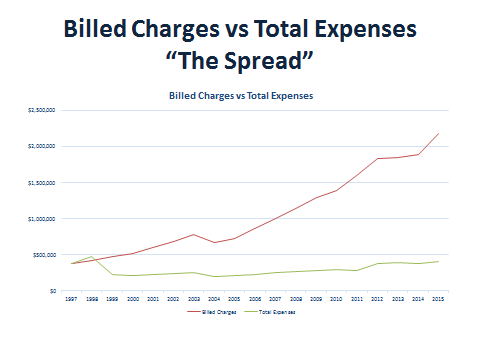
The green line in the second graph is documented actual cost of health care as reported to CMS. The red line represents arbitrary charge master rates to which insurance companies can claim a “savings” to their customers in the form of “discounts.”
Reference based pricing plans tie their reimbursement to the green line (cost). If the green line remains a straight line, so to health care costs under a Reference Based Pricing Plan.
