

Waking up is hard to do. I’ve been trying for years. Even nightmares couldn’t wake me up until yesterday when I had a horrible one that lit me up like a Roman Candle. I shot out of my hiding place, raced to the library and found the 2017 Milliman Medical Index report. “Its true, its true, this is not another nightmarish dream, its true!” assured the sweet librarian.
“But it can’t be” I screamed. When I went to sleep in 1973 health insurance rates of $17 for individuals and $35 per month for family coverage were considered competitive! What the hell happened?”
“Government got involved, managed care contracts memorialized collaborative schemes to defraud consumers into thinking they were getting great “discounts” when in fact they were assured of paying more year after year, hospitals took lessons from used car salesman and invented something called a Charge Master, and health care supply chain managers (insurance brokers, agents and consultants) were tasked, and they accepted their role to make sure the new status quo remained forever” said the librarian with head hanging low and slumped shoulders.
“They say the only way to fix this is more government control through a single payer system. Go figure!” she continued. “I’m moving to Communist China where the free market in health care is alive and well!”
2017 Milliman Medical Index
By Christopher S. Girod, Susan K. Hart, Scott A. Weltz | 16 May 2017
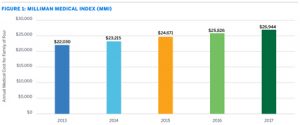
In 2017, the cost of healthcare for a typical American family of four covered by an average employer-sponsored preferred provider organization (PPO) plan is $26,944 (see Figure 1), according to the Milliman Medical Index (MMI).1
Key findings of the 2017 MMI include:
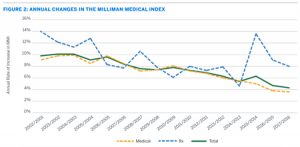
- The MMI’s annual rate of increase is 4.3%.This is the lowest rate since we began tracking the MMI in 2001. Yet the total dollar amount is still bracingly high. Of the $26,944 spent by the MMI’s family of four, $11,685 is paid by the employee, through a combination of $7,151 in payroll deductions for premium, and $4,534 in out-of-pocket costs incurred at time of care.
- Prescription drug trends are lower, but still high.For the first time since 2013 and 2014, the family of four’s prescription drug trends have decreased in two consecutive years. Still, the 2017 prescription drug cost increase of 8% is more than double the medical increase of 3.6%.2
- Employees pay a bigger piece of the healthcare cost pie.Through their payroll deductions and through out-of-pocket expenses incurred when care is received, employees now pay for about 43% of expenses and employers pay the other 57%. The difference between these two shares has gradually narrowed since 2001, when employees contributed 39% and employers contributed 61%. High growth in per-employee healthcare expenditures have pushed employers to limit their contribution increases to amounts below the rate of healthcare inflation.
Some stakeholders have held out hope that federal healthcare reform efforts would help control healthcare cost growth. So far, those efforts have had relatively little direct impact on the MMI, because the MMI represents healthcare costs in an employer-sponsored health plan, while the primary focus of healthcare reform has been on the individual insurance marketplace and Medicaid. The employer market tends to be one of the most stable markets for health insurance companies, and one of the most financially important for healthcare providers such as hospitals and physicians. As discussed in a later section of this report, providers receive higher payment for patients in employer-sponsored plans, for the exact same basket of services, than they do for other insured patients. Employers and employees have been subsidizing other markets for many years.
Additional resources
- Milliman Medical Index archives
- Understanding healthcare costs: The employer-sponsored insurance system
- The story behind the Milliman Medical Index
1The Milliman Medical Index is an actuarial analysis of the projected total cost of healthcare for a hypothetical family of four covered by an employer-sponsored preferred provider organization (PPO) plan. Unlike many other healthcare cost reports, the MMI measures the total cost of healthcare benefits, not just the employer’s share of the costs, and not just premiums. The MMI only includes healthcare costs. It does not include health plan administrative expenses or insurance company profit loads.
2In the MMI, prescription drug expenses are measured before any savings generated by manufacturer rebates. For some medications, the drug manufacturer may give a significant rebate to the pharmacy benefit manager (PBM) or health plan after the prescription is filled. Patients typically do not benefit from these rebates at the point of sale, although rebates generally reduce healthcare premiums. Rebates are discussed more in a later section of this report.
Authors
San Diego, CA, US
Tel: +1 858 5878400
Houston, TX, US
Tel: +1 713 6588451
Brookfield, WI, US
Tel: +1 262 7963498
